Introduction to Project
This post documents a Java project created for the Industrial Engineering Computing Methods II course at the University of Arkansas. It is an interactive NCAA Basketball Tournament Simulator that uses real statistical data, machine learning models, and Vaadin that lets the user to select their own matchups, simulate games, build their own brackets, and compare brackets with the simulator outcomes that were generated using Random Forest model. The site also highlights upsets, calculates win probabilities, and adds a shot chart during the simulations. The project uses Vaadin for the web interface, Tablesaw and OpenCSV for data processing, and Smile for machine learning.
The main pages of the app features:
- Simulate Matchup - Lets users select any two NCAA teams and simulate 1,000 games between them to generate a winner using some of there key satistics. ALso displays win probabilities and generates visual shot chart.
- Simulate a Bracket - Allows users to manually advance teams through a full 64-team tournament bracket, seeded by performance scores and organized by region.
- 2025 Bracket Page Lets users fill out their own bracket of the 2025 NCAA tournament and compares their picks to predictions made by a Random Forest model trained on historical data.
Data Handling, Calculations, and Simulation Logic
For this project the primary data sources include ncaab.csv file which was our historical NCAA tournament data and the cbb25.csv file which was the 2025 season data. This csv file was cleaned and saved as cbb25cleaned.csv file after we got rid of missing data from it by replacing all missing values with “-1”.
We used Tablesaw to load and manipulate both datasets across different classes like in Main.java, SimulatedBracket.java, and BracketView_2025.java and in SimulateView.java, we used OpenCSV.
Team strength was calculated using weighted z-scores across metrics like:
- Adjusted offensive/defensive efficiency
- Effective field goal percentage
- Turnover rates
- Offensive/defensive rebounding
- Free throws made and attempted
These z-scores were combined into a composite score for each team and then we used the, to, seed teams in bracket for the simulations, Compare each teams, and for the win probabilities
In SimulateView.java, we ran 1,000 simulations per matchup. Each simulation added a small amount of randomness to the calculated scores to sort of mimic game upsets like in real tournaments.
The BracketView_2025.java class used a Random Forest model trained on historical postseason data. Here users could simulate a full bracket, submit their own picks, and compare against model prediction.
Java Classes Overview
- Application.java – The main entry point that launches the Vaadin website.
- WelcomeLayout.java – Sets the top banner, left-hand navigation bar, and layout of the website.
- HomeView.java – Displays a simple introductory welcome page with the NCAA logo and a simple message when the viewer opens up the website.
- SimulateView.java – Powers the Simulate Matchup page and runs 1,000 simulation games for the selected teams and generates a shot chart.
- SimulatedBracket.java – Responsible for creating and simulating an entire tournament bracket and also seeding and all the different rounds.
- BracketView_2025.java – Provides a fully interactive bracket where users submit picks and compare their results against the predictions made by the Random Forest Machine Learning Model.
- Main.java – Responsible for loading and processesing the CSV data, calculates weighted z-scores, and determines team strength.
- Construction.java / Construction2.java / Construction3.java – All three classes are used to represent each of the teams’ statistics from the CSV file.
- UserDoc.java – Creates the “How It Works” page with technical explanations of simulation logic and model training.
- AboutPage.java – Builds the “User Guide” page with step-by-step instructions for using each feature of the app.
Project Overview
Below are screenshots of the main pages of from Vaadin
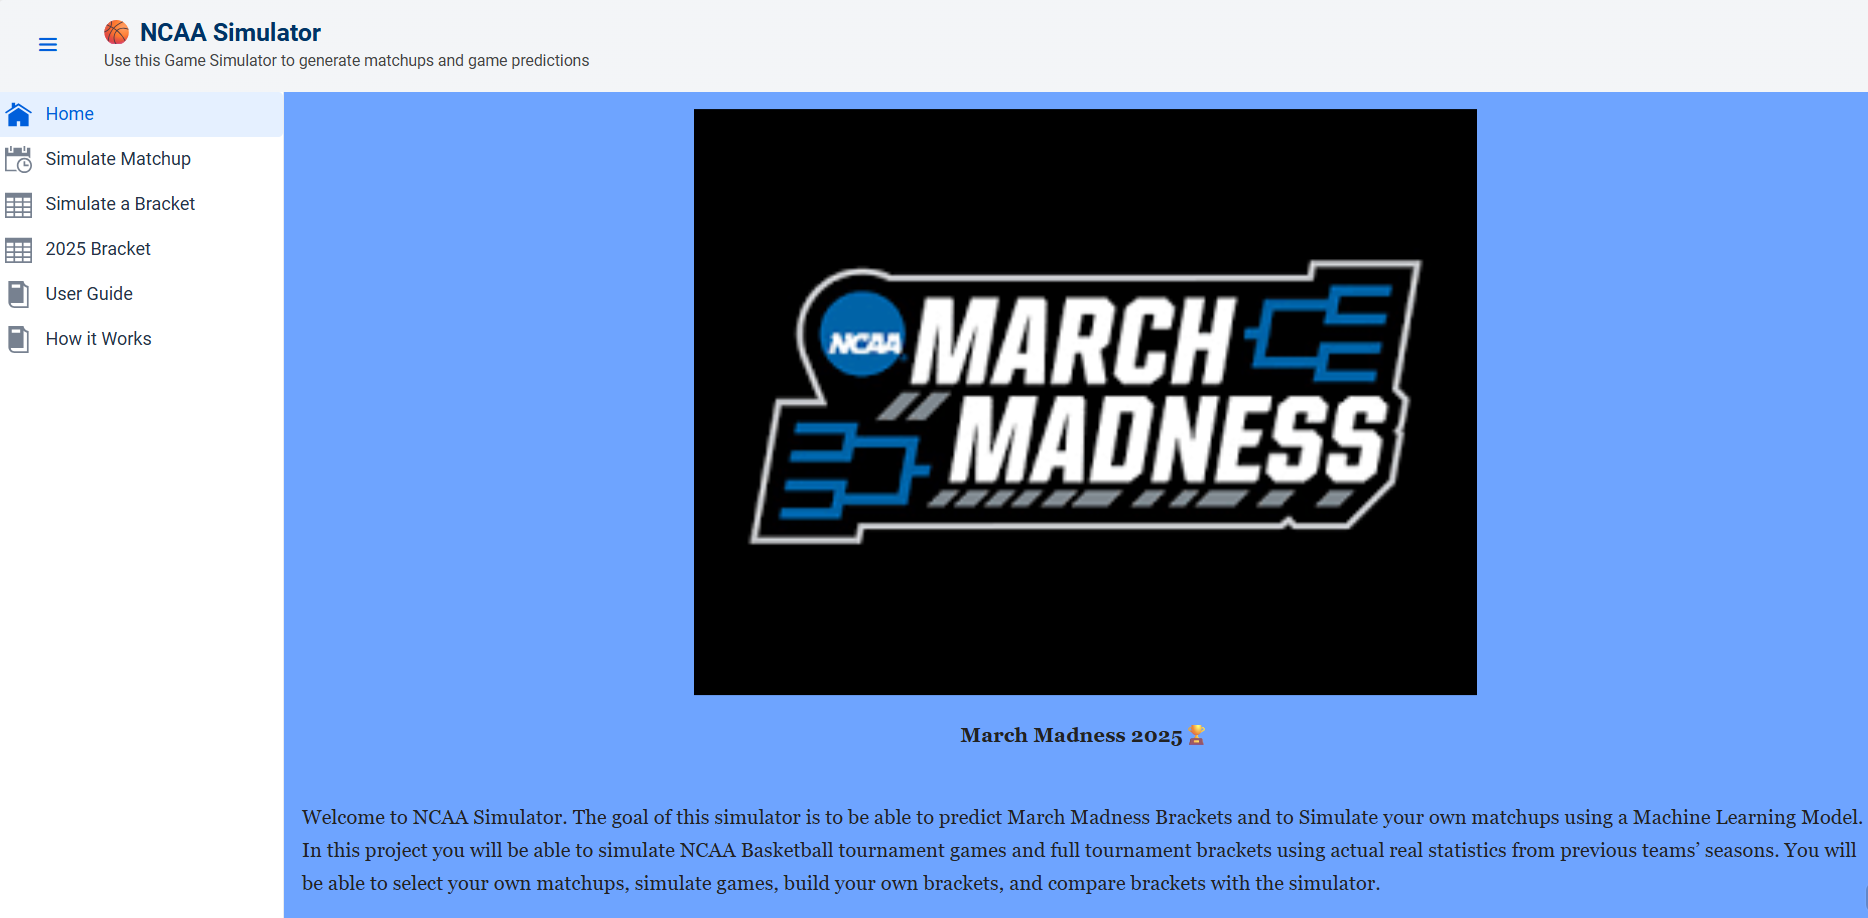
The Home Page is the first screen users see when launching the NCAA Tournament Simulator. It features a clean layout with the NCAA logo and a brief welcome message. It also has a left navaigation bar to switch between different modes. This page introduces users to the interface.
A left-hand sidebar provides easy navigation to all other pages of the site, including:
- Simulate Matchup
- Simulate a Bracket
- 2025 Bracket
- User Guide
- How It Works
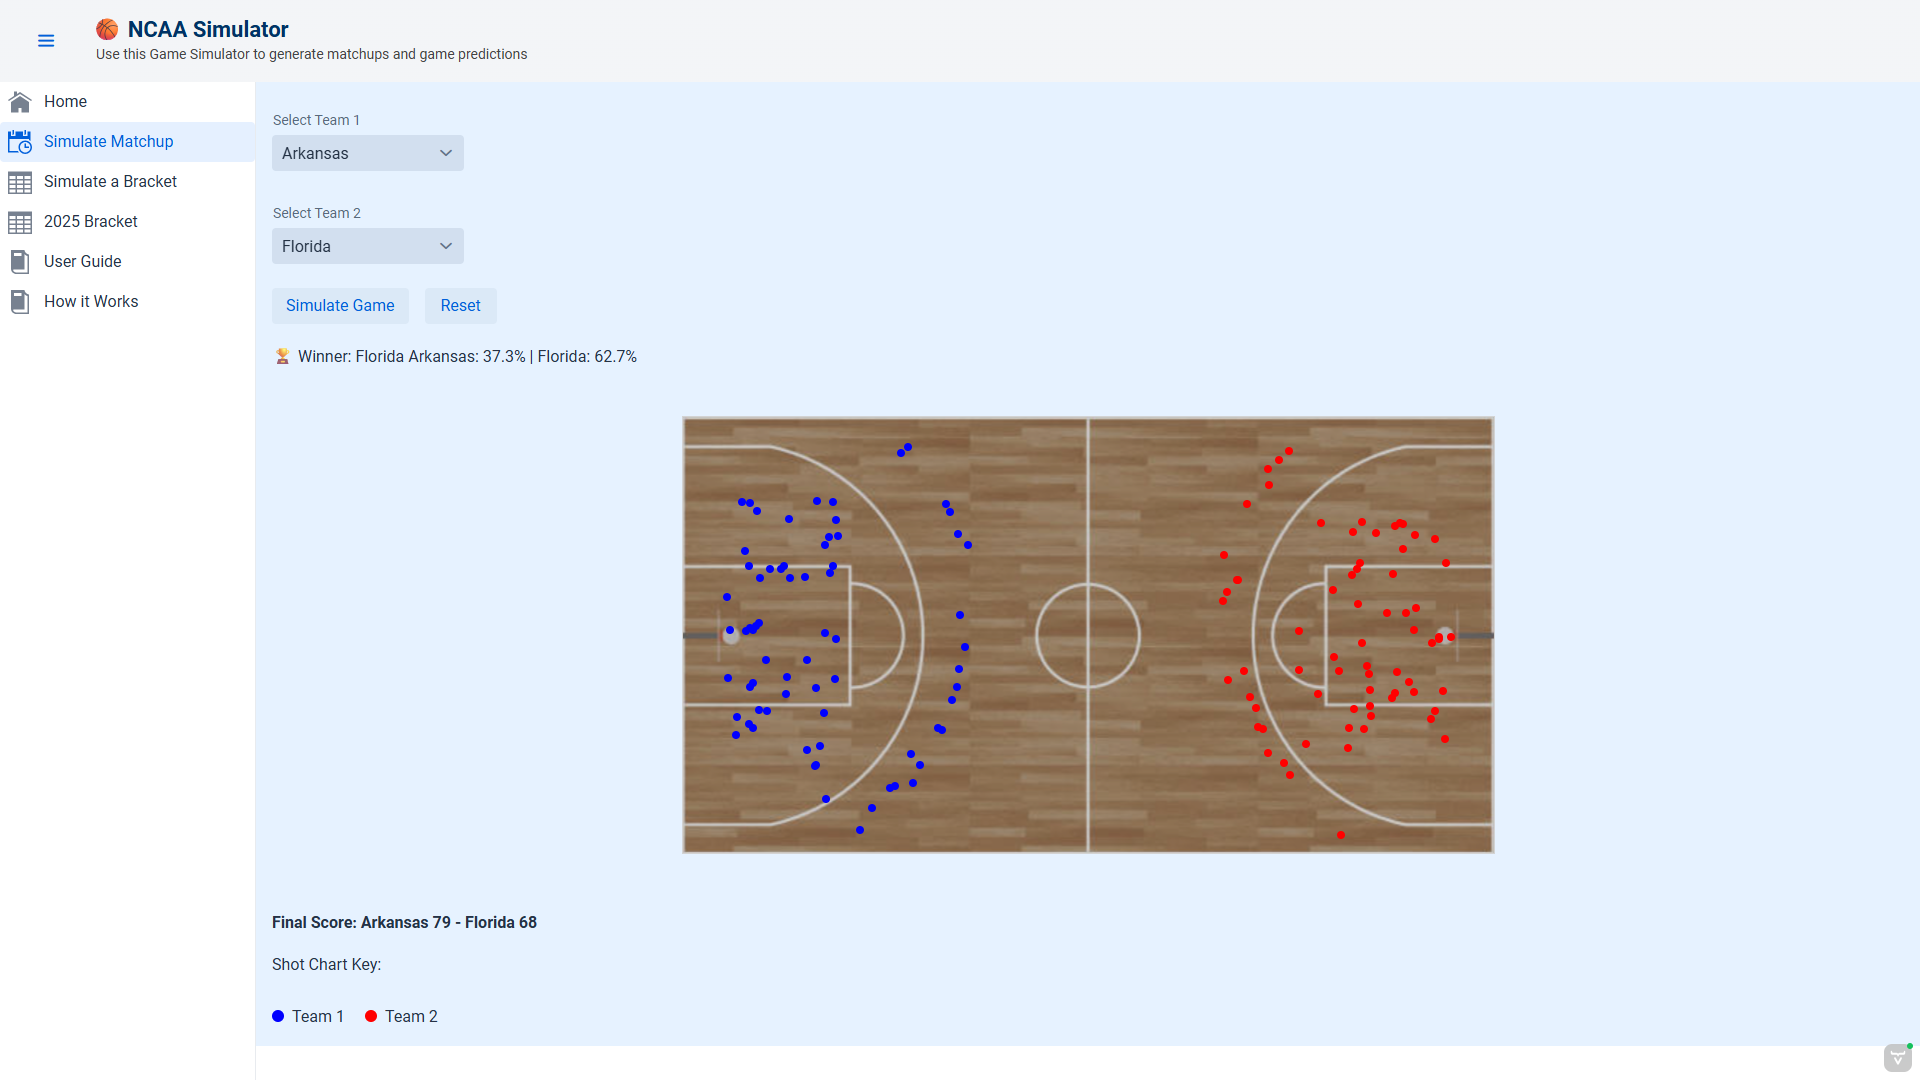
This page allows users to select any two NCAA basketball teams and simulate a head-to-head matchup based on real statistical performance from the 2024 season. Once the user selects Team 1 and Team 2 using the dropdown menus, they can click “Simulate Game” to run 1,000 virtual matchups.
Each simulation calculates a weighted z-score for both teams using some of their performance stats such as adjusted offensive and defensive efficiency, rebounding rates, and turnover rates. Randomness is also added to reflect the unpredictability of real tournament games. The result includes:
- A win probability for each team
- A final score based on simulated shots
- A visual shot chart overlaid on a virtual basketball court
The page also includes a “Reset” button to clear the simulation and try new matchups.
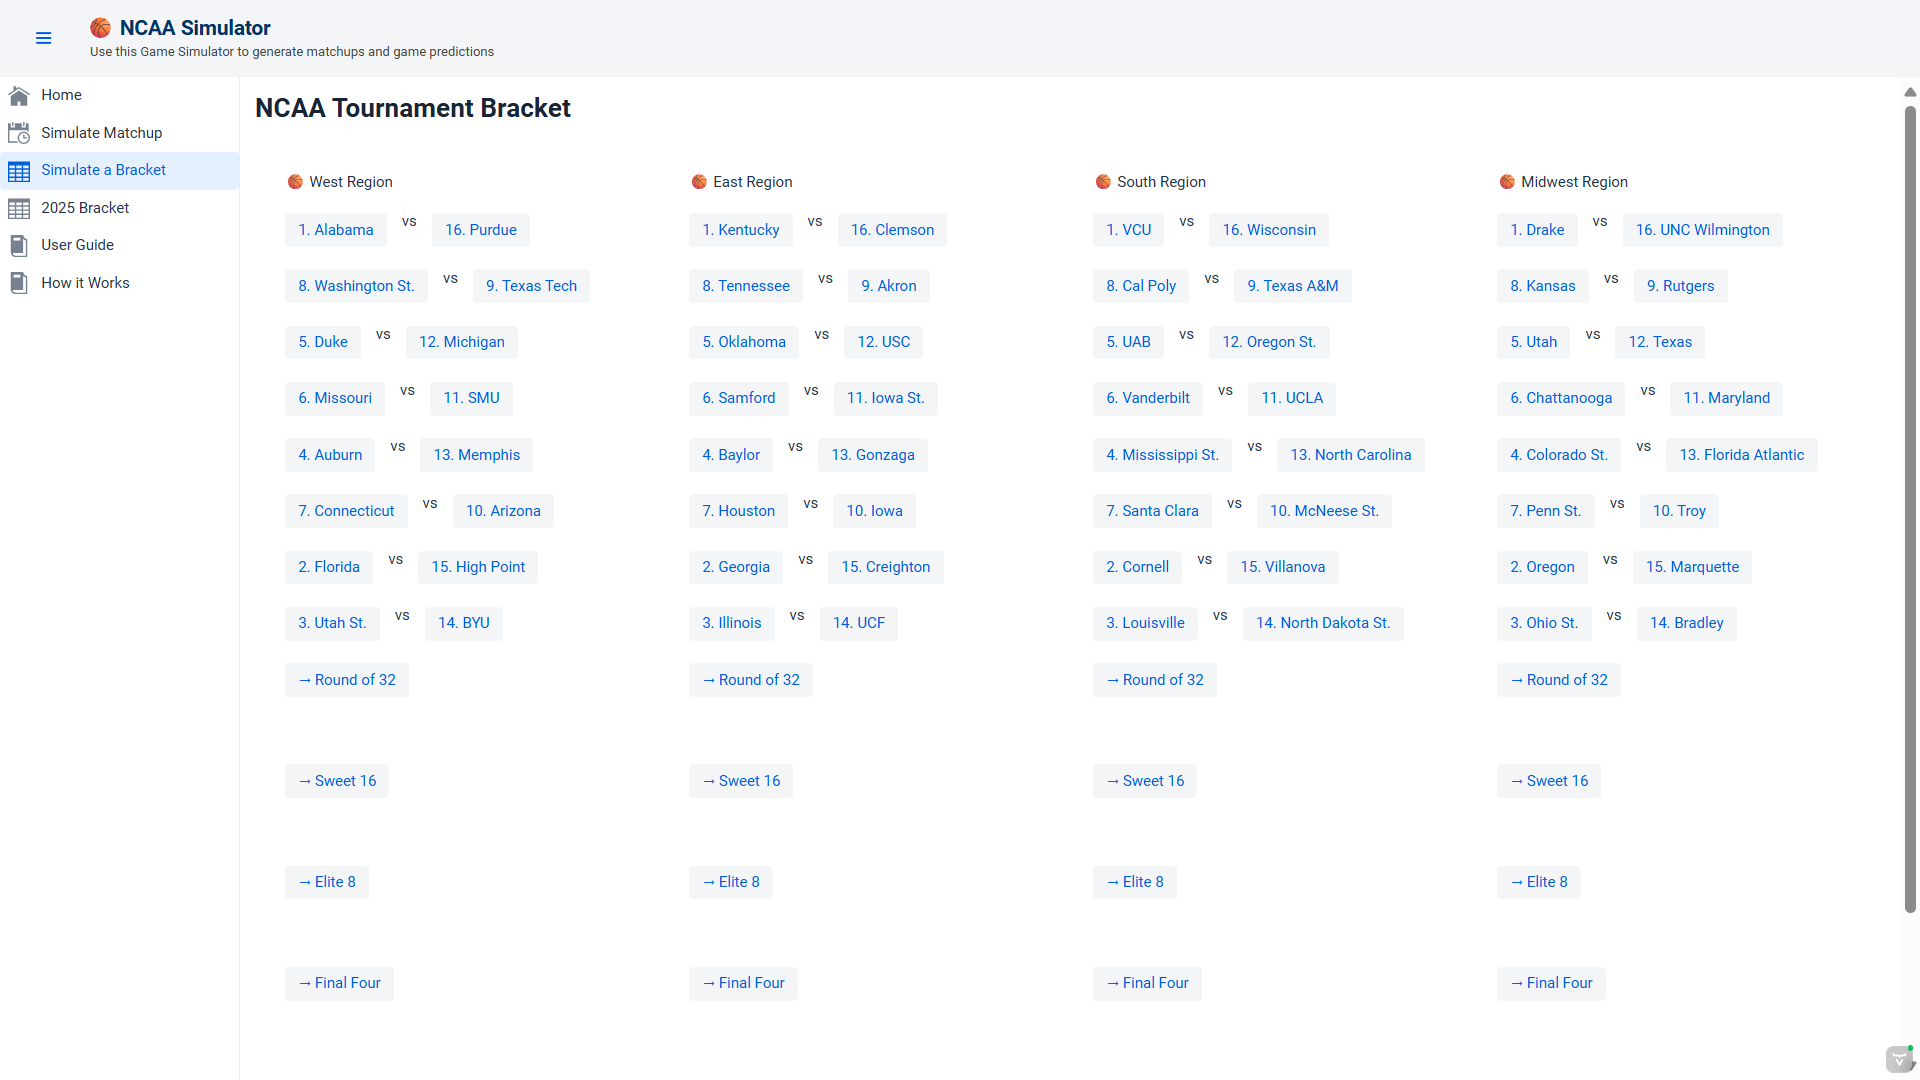
This page allows users to generate and interact with a full 64-team NCAA tournament bracket. When the user clicks the “Generate Interactive Bracket” button, the simulator selects the top 64 teams based on their weighted z-score rankings and distributes them into four regions: East, West, South, and Midwest.
Each region begins with first-round matchups, and users manually advance teams by clicking on their preferred winners. After completing each round, the Round of 64, Round of 32, Sweet 16, Elite 8, and Final Four, the user can progresses until a final champion is reached.The simulator uses real 2024 NCAA statistics to seed the teams and includes visual region layouts that mimic an official bracket format.
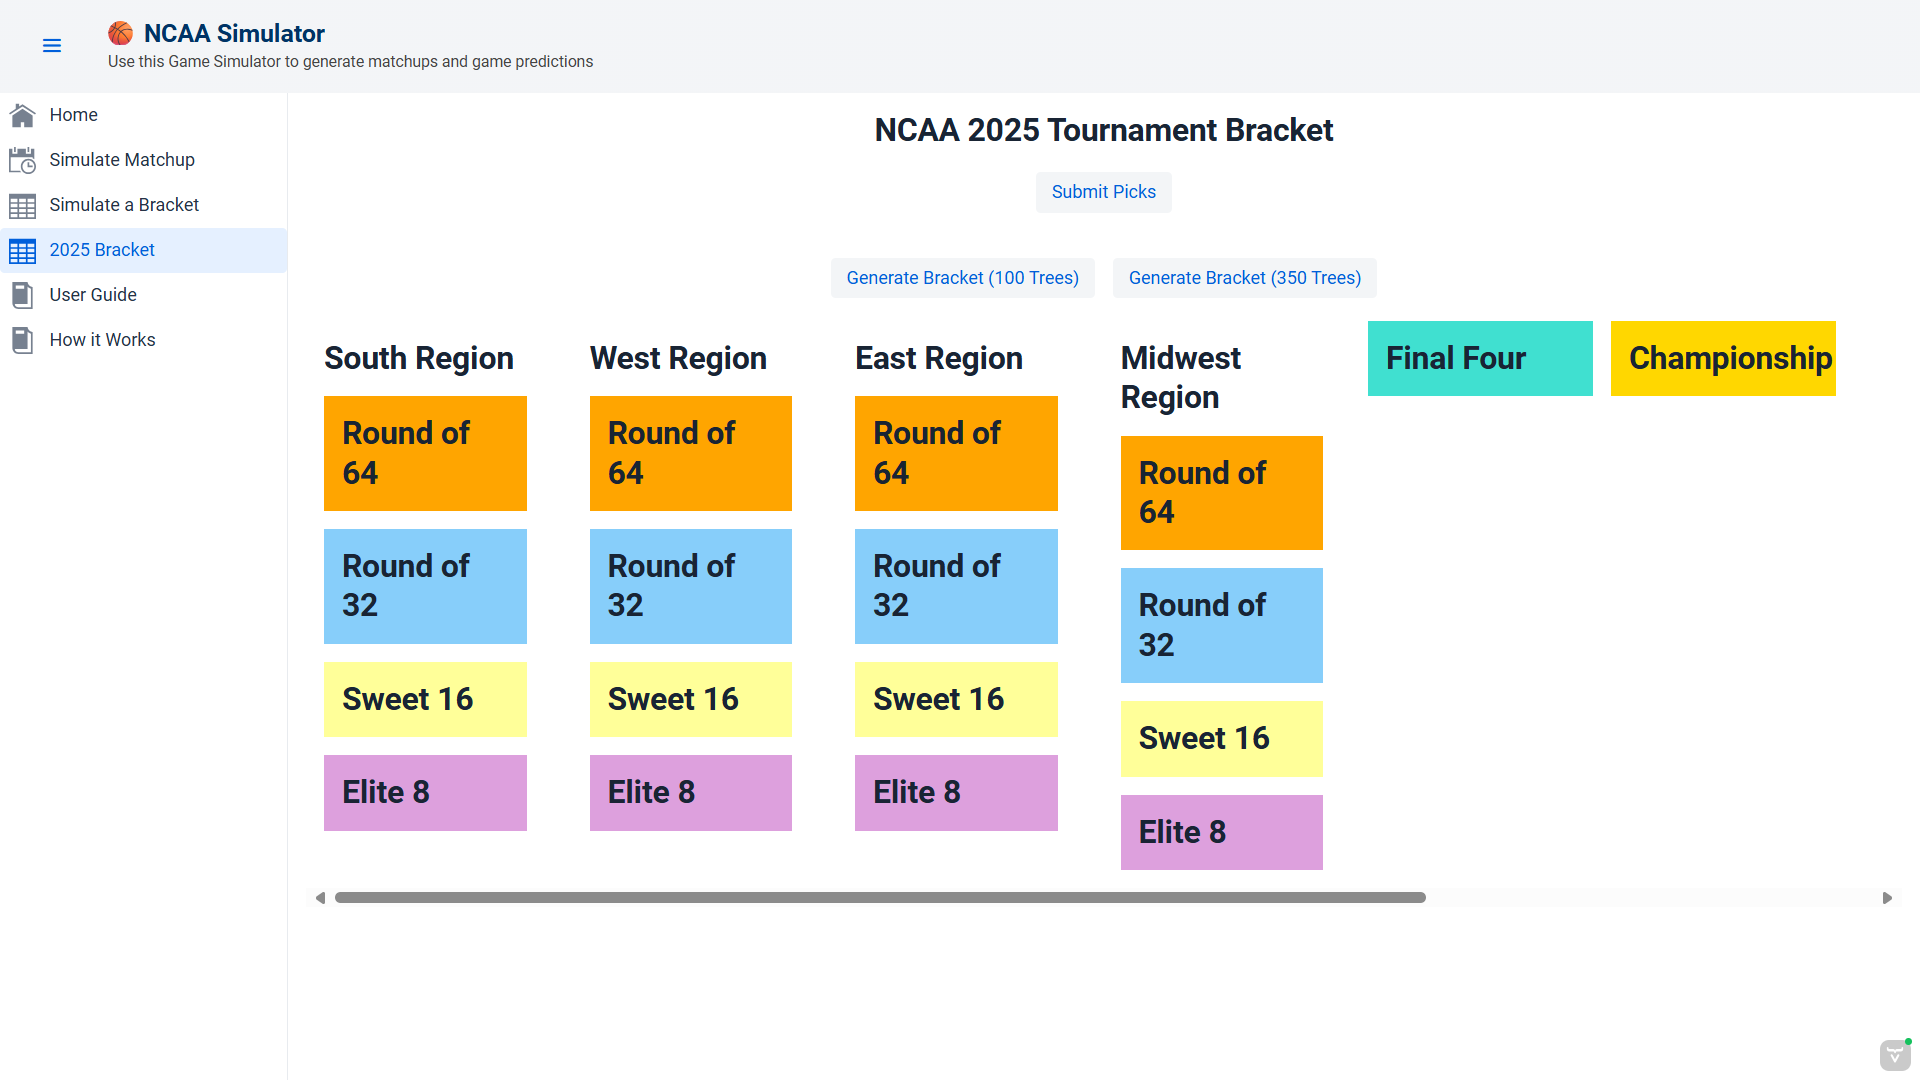
The 2025 Bracket Page is an interactive prediction tool that allows users to fill out a full NCAA tournament bracket and compare their picks to a machine learning model’s predictions. The user starts by choosing whether to generate predictions using a Random Forest model with either 100 or 350 decision trees — trading off between speed and accuracy.
The bracket is based on the actual 2025 NCAA tournament layout, including real teams, seeds, and regions. Users manually select winners for each matchup through each round of the tournament. After completing their picks, they click the “Submit Picks” button to receive feedback.
The app evaluates their bracket against the model’s predictions and provides:
- A percentage of correct picks
- The predicted champion
- A randomly selected upset match
The model is trained on historical postseason outcomes using stats like adjusted efficiency, effective field goal percentage, rebounding, and turnover rates.
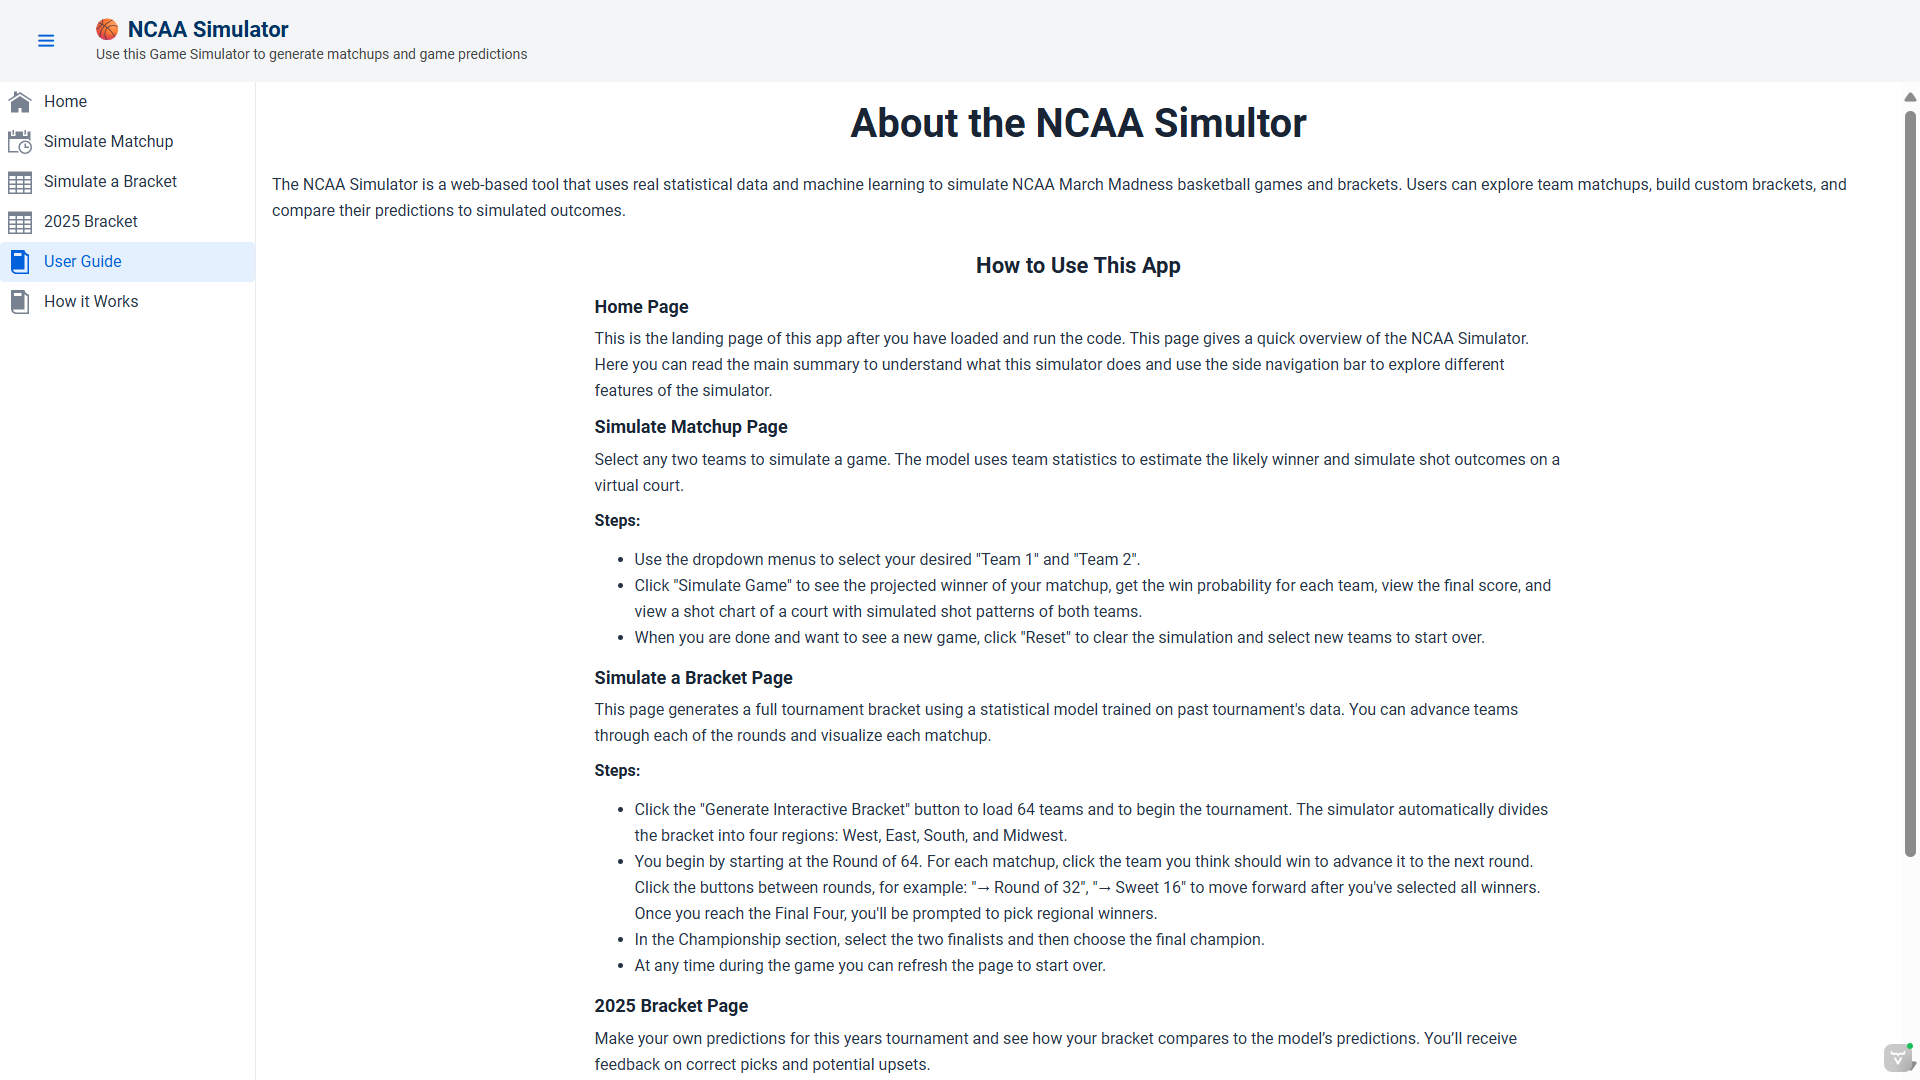
The User Guide gives step-by-step instructions for using each part of the app including simulating games and filling out brackets. This page is meant to be a reference page for the user to understand how to work each page.
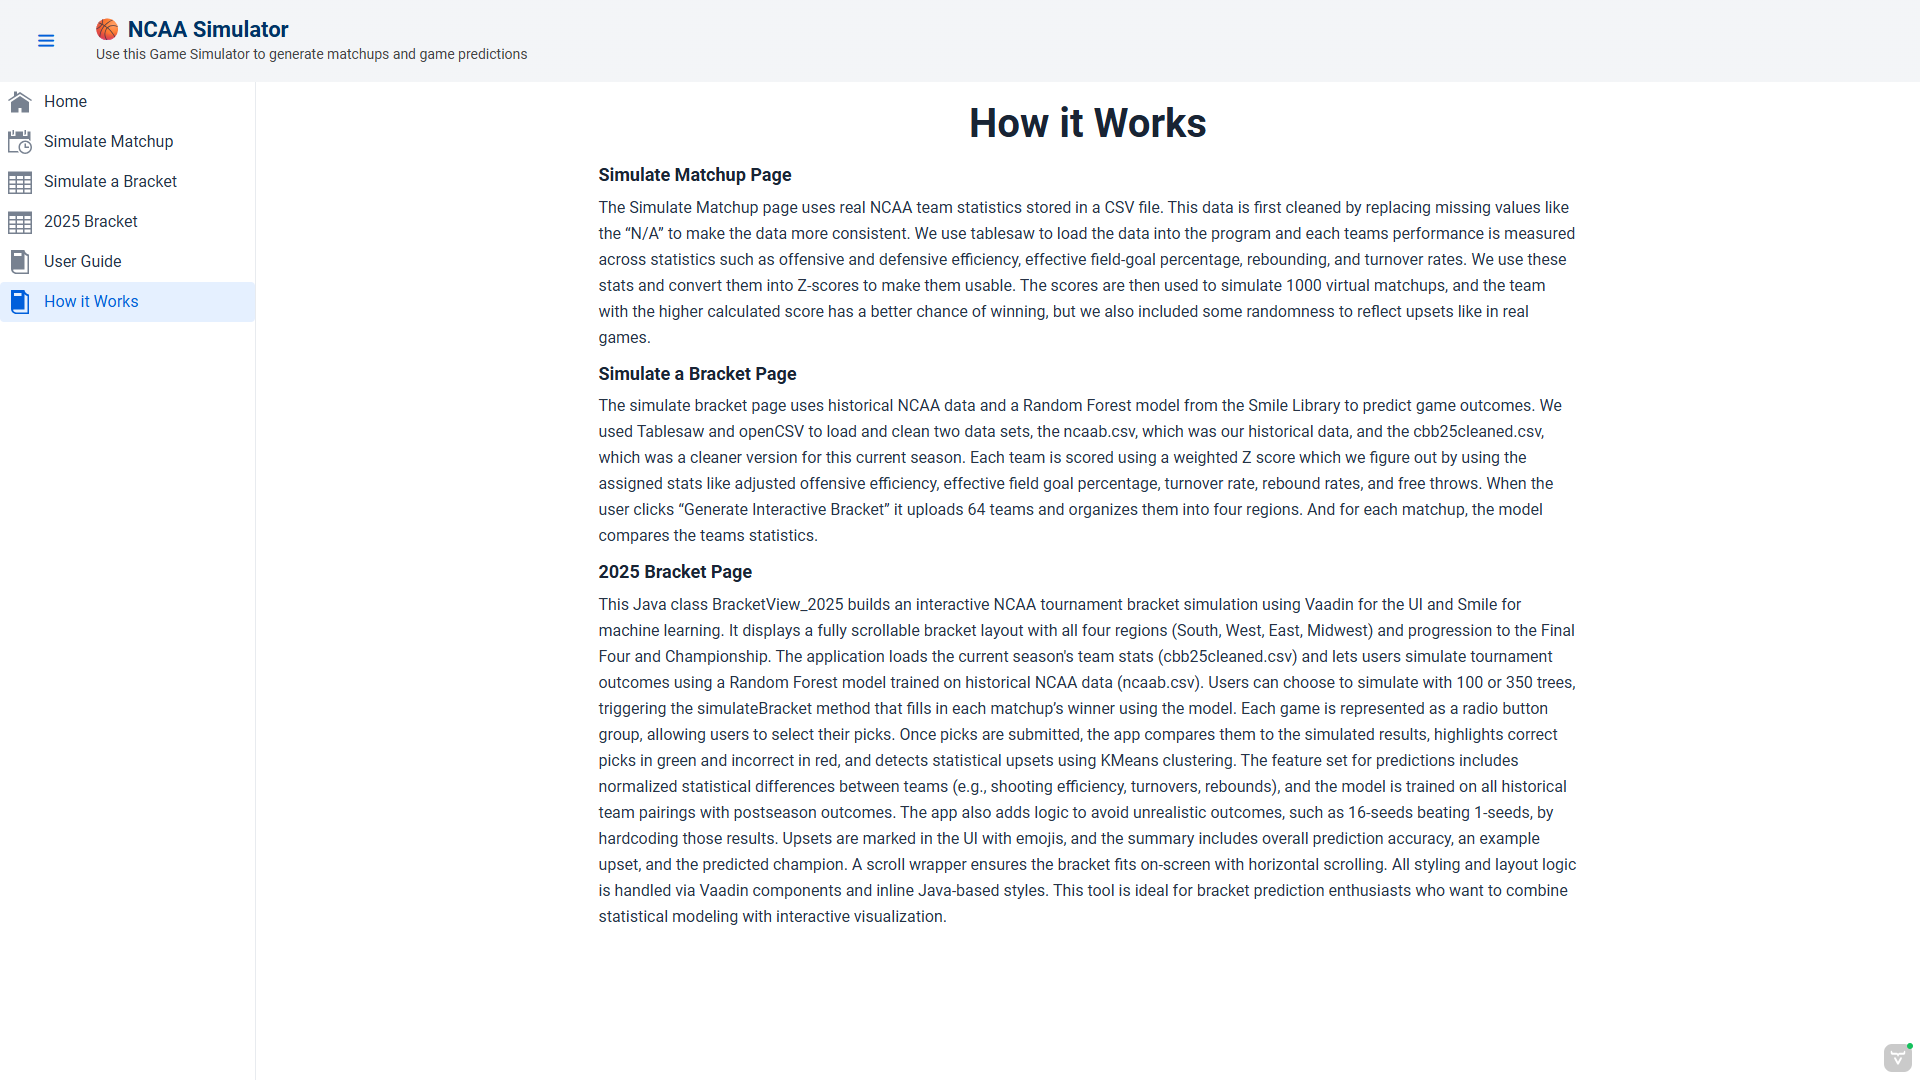
This page provides an explanation of the logic and data processing behind the simulations. It describes how team stats are cleaned, converted into z-scores, and used to calculate matchup outcomes. It also outlines how the Random Forest model was trained and how upsets are made.
Reflection
This project taught me how to integrate multiple tools like Vaadin, Tablesaw, and Smile, to build an entire application from scratch. It being a project that lasted several weeks and was much larger than anything else I ever coded, was what I think helped improve me the most. One of the biggest challenges was all the different tools that had to be used which kind of forced me to go back and relearn everything but also made me more confident in using these tools. My favorite part about the project was that there wasnt really a structure or a set guidline to follow, I had to come up with the decsions which made everything less complicated.